Task Tracker Excel: One File That Plans, Prioritizes and Repeats Tasks
Task tracker excel setup in one file: the 5 columns every list needs, recurring tasks you enter once, and a matrix, Kanban and Gantt built from the same rows.
By All-in-One Task Tracker by Cosmo Suite · Editorial policy
Published · 7 min read
Most Excel task trackers stop working for one of three reasons. Recurring tasks get copied manually every week. Nothing indicates what to do first. And the timeline lives in a different file from the list. Each fix is simple individually; getting all three to share one set of rows takes more work.
The short answer: build one task table with five columns (due date, priority, status, recurrence, owner). Keep recurring tasks on their own tab, entered once. Then make every other view (calendar, priority matrix, Kanban, Gantt) read from those rows instead of holding its own copy.
This guide walks through that setup on a realistic week of 12 tasks, then shows where a ready-made file saves you the building.
Excel Task Trackers at a Glance
A task tracker in Excel is a worksheet table of tasks with dates, priorities and statuses, plus the views that summarize it. There are three ways to build one, and the right approach depends on how many views you need.
| Setup | What you get | Where it breaks | Best for |
|---|---|---|---|
| Plain list (one sheet) | Task, due date, status, a filter | Recurring tasks, deciding what comes first | Under 20 open tasks, no repeats |
| Home-built tracker | Table, dropdowns, overdue highlighting, a progress count | Every extra view is a new build to maintain | People who enjoy building formulas |
| Linked template | List, recurring tab, calendars, matrix, Kanban and Gantt on the same rows | You learn someone else's layout first | Mixed work, study and home tasks with repeats |
Most readers start with the first option, outgrow it within a month, and end up somewhere between the second and third.
The 12-Task Week, Worked Through
Here is a typical Monday list: 8 one-off tasks and 4 that repeat.
| Task | Type | Due | Urgent? | Important? |
|---|---|---|---|---|
| Draft quarterly report | One-off | Wed | Yes | Yes |
| Book dentist | One-off | Fri | No | Yes |
| Renew passport | One-off | Next month | No | Yes |
| Reply to landlord about the boiler | One-off | Mon | Yes | Yes |
| Sort old photo folders | One-off | None | No | No |
| Order a birthday gift | One-off | Thu | Yes | No |
| Fix the printer settings | One-off | Tue | Yes | No |
| Read the new team handbook | One-off | Fri | No | Yes |
| Weekly team update | Every week | Mon | Yes | Yes |
| Friday expenses | Every week | Fri | No | Yes |
| Put the bins out | Every week | Tue | Yes | No |
| Monthly bill check | Every month | 1st | No | Yes |
On a plain list, those repeats need new rows every cycle: 52 weeks × 3 weekly tasks + 12 monthly checks = 168 rows a year typed by hand. Miss one copy and the task quietly disappears. An Excel tracker that takes each repeating task once removes that copying.
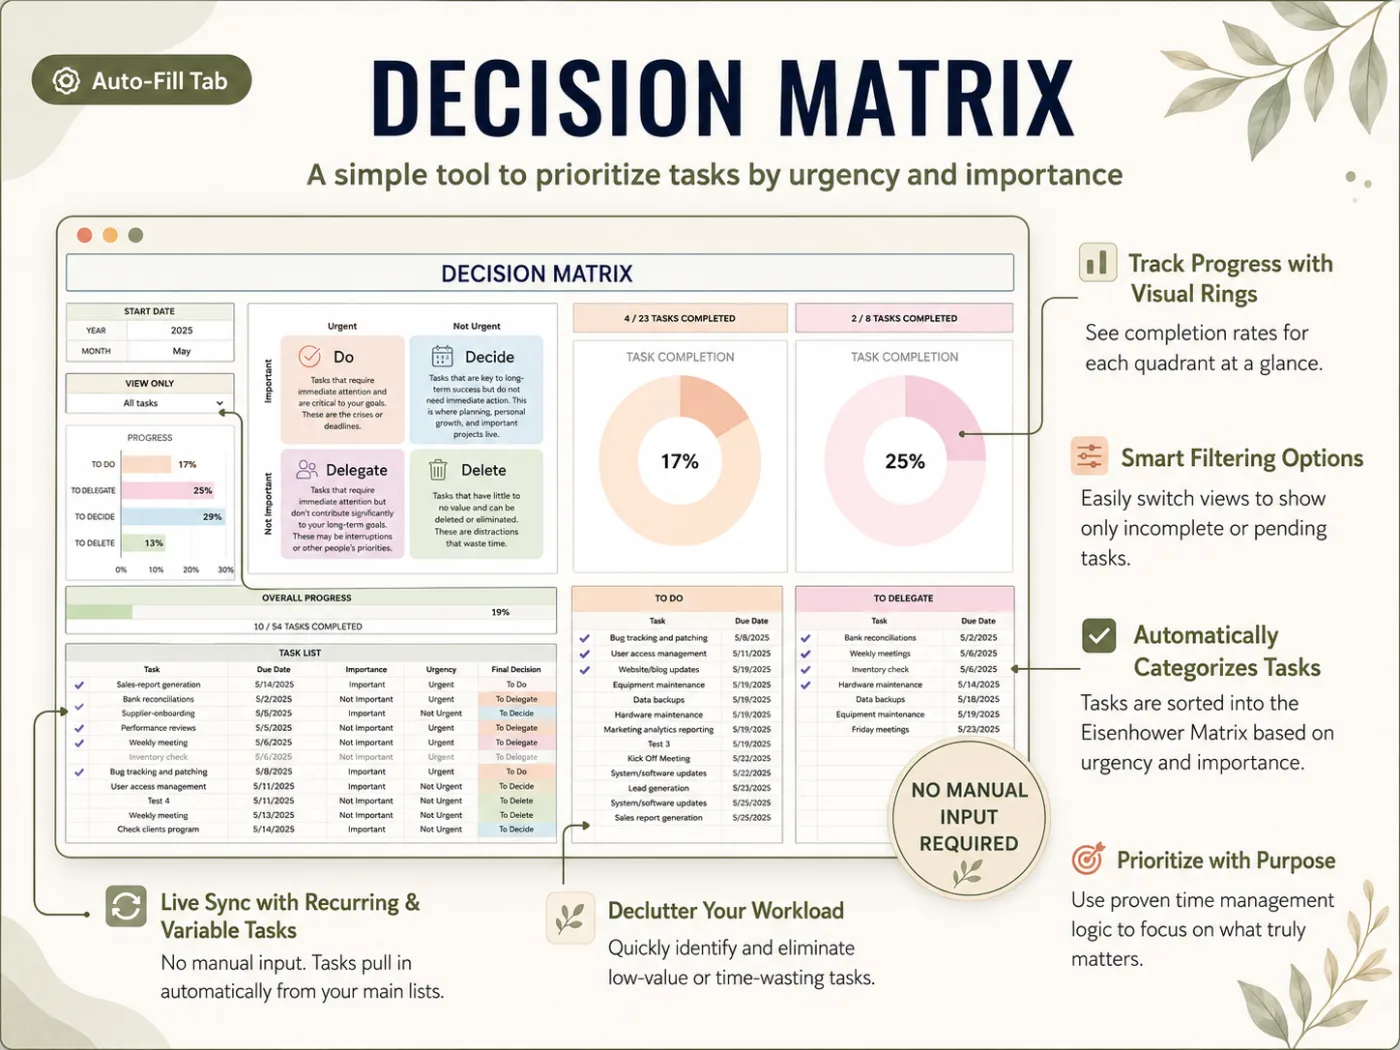
The urgent and important columns sort the week into four groups. There are 3 tasks to do now (report, landlord, team update) and 5 to schedule (dentist, passport, handbook, expenses, bill check). Another 3 can be handed off or batched (gift, printer, bins), and 1 can be dropped or parked (photo folders).
The Eisenhower matrix is that four-box split by urgency and importance. It's named after Dwight Eisenhower, who quoted a former college president in a 1954 address in Evanston, Illinois on having two kinds of problems, the urgent and the important. It answers "what do I do first today" before you open your inbox.
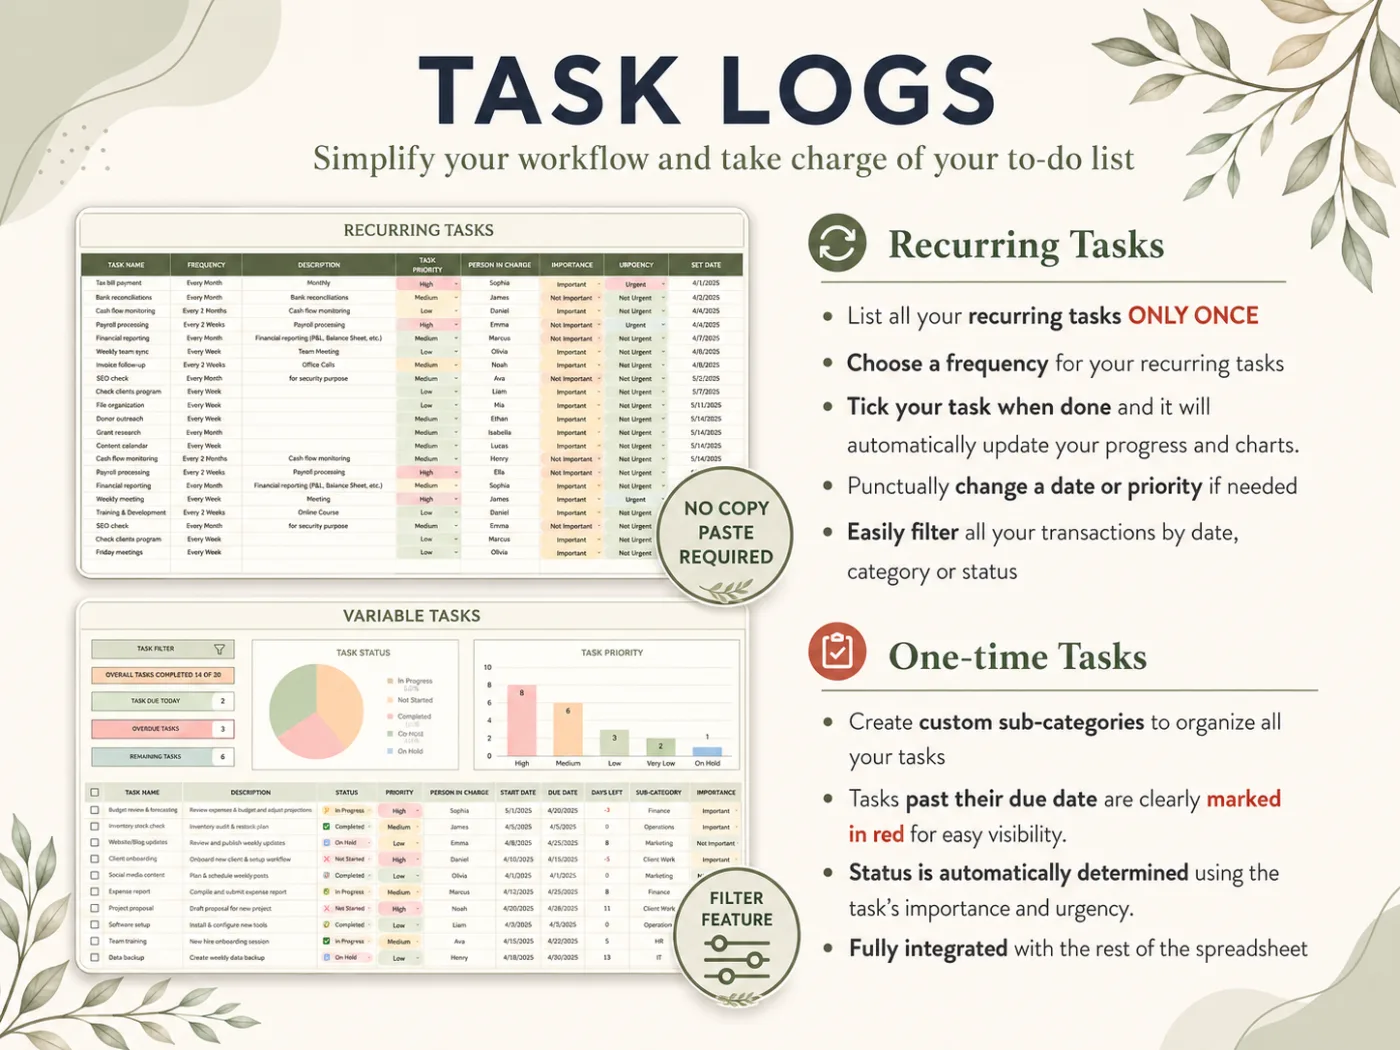
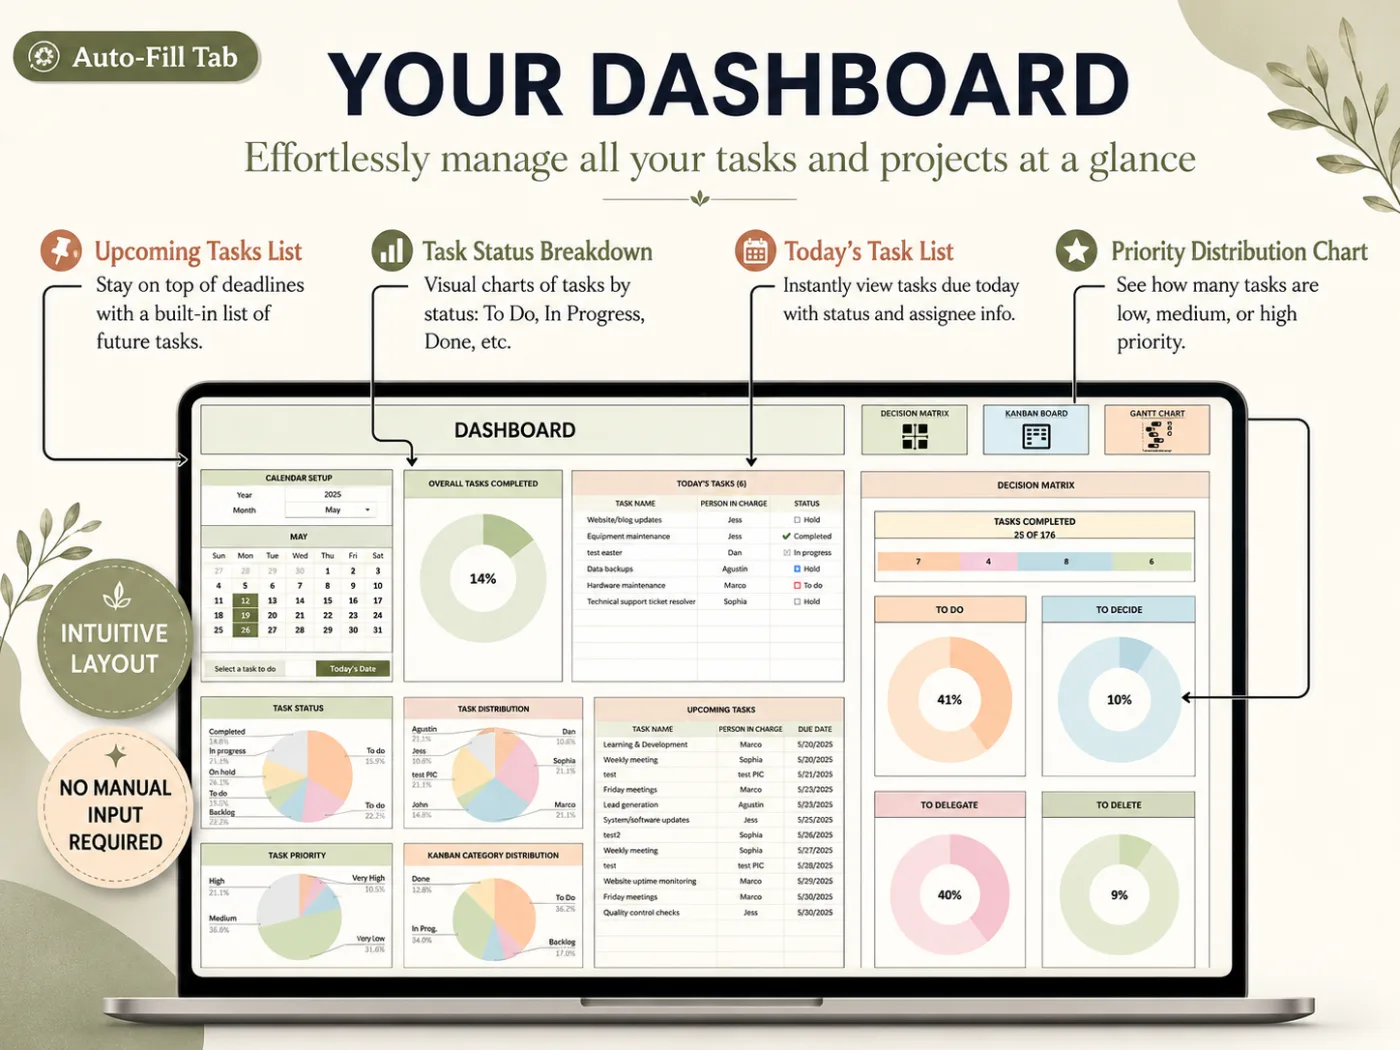
The screenshot shows the tracker's built-in sample data, not the 12 tasks above.
Step 1: Turn the List Into a Table
Start with an Excel table, not a loose range. An Excel table is a named block of rows and columns that Excel manages as one object. Select your headers and press Ctrl+T. Microsoft's overview of Excel tables lists the benefits: every header gets a filter, and a formula typed once in a column fills the whole column.
Use these columns, in this order:
- Task: a short verb phrase ("Draft quarterly report").
- Due date: a real date, not "next week".
- Priority: High, Medium, Low.
- Status: Not Started, In Progress, On Hold, Completed.
- Recurrence: One time, Every Week, Every Month and so on.
- Owner: you, or the person you delegate to.
The last two are the ones most templates omit, and they determine whether the list survives its second month.
Step 2: Lock the Choices With Dropdowns
Status and priority only function if they're spelled identically every time. "Done" and "Complete" count as two different statuses to a formula. Every task marked Complete therefore drops out of a COUNTIF on Done.
Excel's data validation converts a column into a dropdown list. Create one for Status, Priority and Recurrence. Then a progress percentage needs one formula: =COUNTIF([Status],"Completed")/COUNTA([Task]). On the 12-task week, finishing the 3 Do-now tasks by Monday night gives 3 ÷ 12 = 25%.
Step 3: Make Overdue Tasks Impossible to Miss
Due dates only help if they're visible. Add a conditional formatting rule on the Due date column with the formula =AND($B2<TODAY(),$D2<>"Completed") and a red fill. Then add a "days left" column with =B2-TODAY() so the number shrinks each morning.
For example, open the file on Wednesday: if the printer task is still Not Started, its row is red and shows -1.
Step 4: Give Recurring Tasks Their Own Tab
A recurring task is one that comes back on a fixed cycle, such as every week or every month. Keep a second table for these only: task, frequency, start date, owner. A schedule then calculates the next date for each one, and your daily view reads from both tables. That single table replaces the 168 hand-typed rows.
Building that schedule yourself requires date math per frequency (weekly adds 7 days, monthly uses EDATE, quarterly EDATE(date,3)). You also need a combined view that stacks one-off and recurring tasks. It's achievable, and it's where most home-built trackers stop.
Step 5: Add the Views, Fed From the Same Rows
Once the list is clean, each view asks a different question of the same rows:
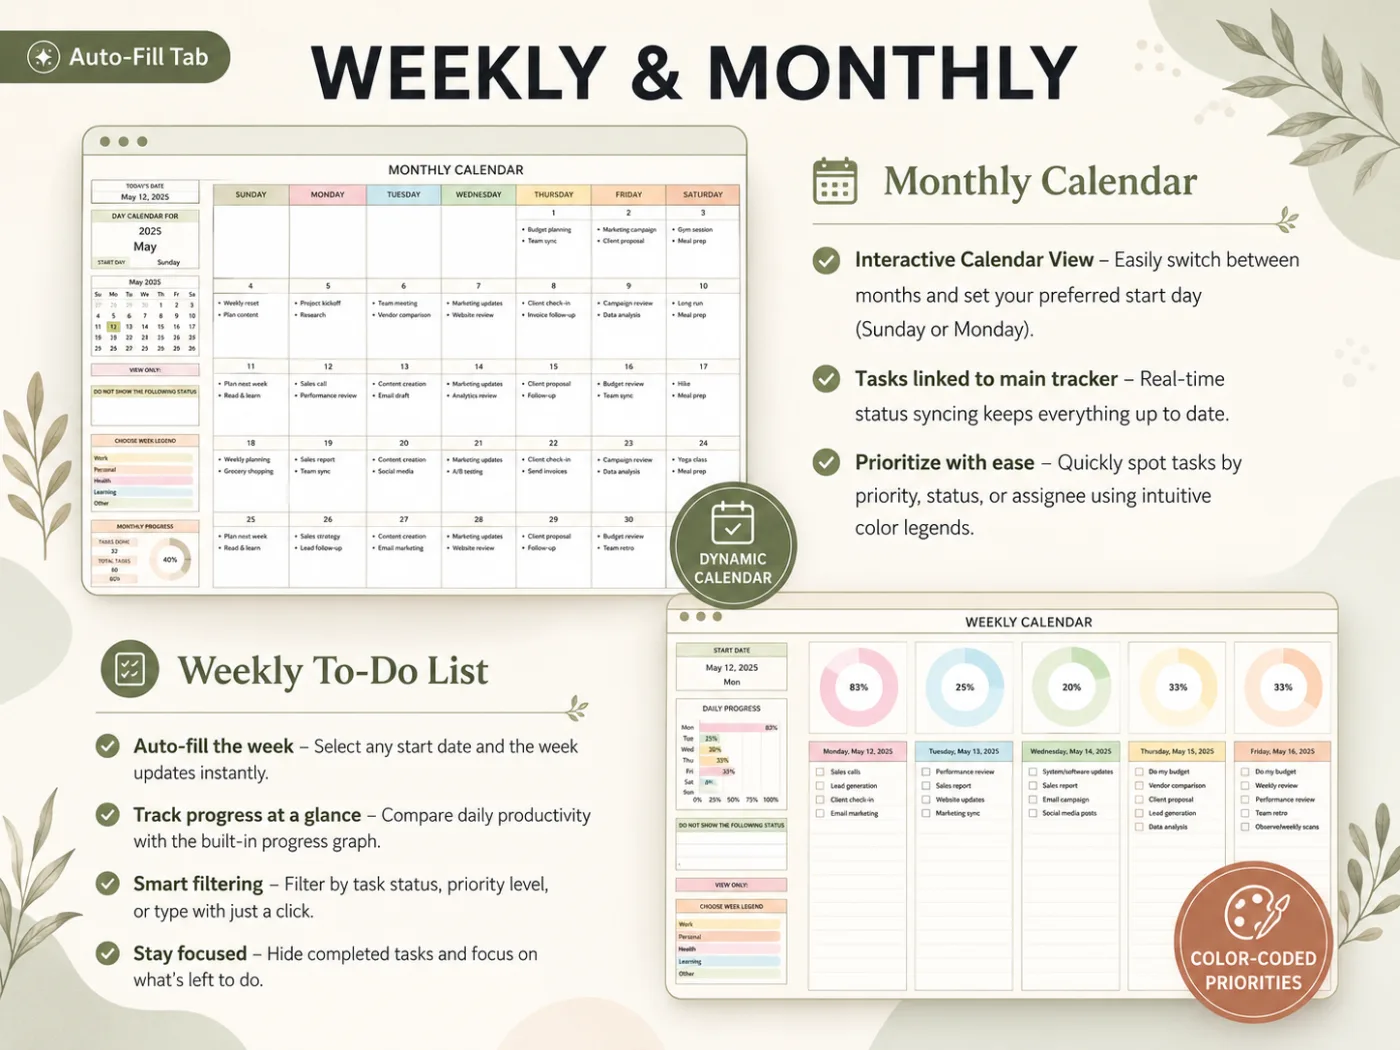
- Calendar (weekly, monthly): what is due when. Answers "is Thursday overloaded?"
- Decision matrix: urgent × important. Answers "what do I do first?"
- Kanban board: columns by status. Answers "what is stuck?"
- Gantt chart: bars by start and end date. Answers "will the bigger job finish on time?"
One rule keeps this manageable: no view gets its own data entry. Type a task directly into the Kanban board and it lives in two places, and one of them will be wrong by Friday.
The Part Most Excel Tutorials Leave Out
The typical tutorial ends at Step 3. What keeps a tracker alive is everything afterward.
Recurrence decides the lifespan. A tracker without a recurring tab works until the first week you forget to copy the repeats, and after that you stop trusting it.
Priority needs two inputs, not one. "High" on its own drifts until everything is High. Separate yes/no columns for urgent and important produce a matrix that sorts itself.
One source of truth beats more features. Five views reading one table is less work than two views each with their own list. It's how a spreadsheet where the calendar, matrix, Kanban and Gantt all read one task list is set up.
Filters beat scrolling. Past about 50 open tasks, filtering by status, owner or due date is how you locate anything. Excel tables include that filtering by default, though a dedicated filter tab with saved choices is faster. Row capacity is rarely the limit, since a worksheet holds 1,048,576 rows according to Microsoft's Excel specifications and limits. Formula-heavy views slow down long before that.
Where This Guide's Numbers Come From
The Cosmo Suite team that makes the All-in-One Task Tracker wrote this guide; you can learn more about the team behind this site. Our methodology: the 12-task week is an example written for this post, and its totals were calculated on 3 October 2026. We opened each Microsoft help page and the 1954 speech record on that date, following our editorial policy on sources and corrections. If something is out of date, contact us through the site and we'll correct it.
Where the All-in-One Task Tracker Fits
The All-in-One Task Tracker is the five-step build above, already done, in one file for Excel and Google Sheets. It has 11 tabs in 4 sections. They are Setup; Dashboards (All-in-One Dashboard, Monthly Calendar, Weekly Calendar); Task Tracking (Variable Tasks, Recurring Tasks, Task Schedule, Task Filter); and Task Prioritization (Decision Matrix, Kanban Board, Gantt Chart).
On the 12-task week, the 8 one-off tasks go on Variable Tasks. The 4 repeats go on Recurring Tasks once, each with a frequency. The Decision Matrix pulls them in and sorts them into Do, Decide, Delegate and Delete. The calendars, Kanban and Gantt read the same rows, and the Task Filter has 15+ options for slicing them. It tracks up to 10,000 tasks and comes with a step-by-step setup PDF and a YouTube tutorial.
You pay $9 once and keep the file. If a simple list is sufficient for now, start with our free task list template and the 5 columns that matter. Students can see the same file run a full term in this semester-long assignment tracker walk-through. To see every tab before you buy, the page for the ready-made Excel and Google Sheets task tracker has a screenshot of each one.
Frequently asked questions
Can I build a task tracker in Excel for free?
Yes. A table with task, due date, priority, status and a recurrence column, plus data validation for the dropdowns and conditional formatting for overdue dates, covers a personal list. It costs nothing but setup time. What takes longer is the second layer: calendars, an urgent and important split, and a timeline that all read from the same rows.
Does an Excel task tracker work in Google Sheets?
Mostly, yes. Tables, dropdowns, COUNTIF and conditional formatting all exist in Google Sheets, though some formulas and filter tools behave a little differently. If you want to use both, pick a template built for both, or test your file in Sheets before you rely on it. The All-in-One Task Tracker comes in an Excel and a Google Sheets version.
How many tasks can an Excel task tracker handle?
It depends on the formulas. A plain table handles thousands of rows without trouble. Trackers that recalculate dashboards, calendars and charts on every edit slow down sooner, so check the stated limit before you commit. The All-in-One Task Tracker is built to track up to 10,000 tasks.
How do I track recurring tasks in Excel?
Give each repeating task one row with a frequency (every week, every month, every quarter) and a start date, then let a schedule generate the next dates. Copying the same task into every week by hand works for a month and then breaks. A dedicated recurring tab stops the duplicates.
Is Excel better than a task app?
It depends on what you need. Apps win on push reminders, calendar sync and shared team deadlines. A spreadsheet wins when you want one file you own, no subscription, and views you can change yourself. Many people with a personal or small-team list do fine with the sheet.
What is the fastest way to get a working task tracker in Excel?
Start from a template that already links the list to its views. Enter your one-off tasks, enter recurring ones once with a frequency, then check the dashboard each morning. With the All-in-One Task Tracker, the setup PDF and YouTube tutorial walk you through the Setup tab first.
Sources
- Microsoft Support: Overview of Excel tables
- Microsoft Support: Apply data validation to cells
- Microsoft Support: Use conditional formatting to highlight information in Excel
- Microsoft Support: Excel specifications and limits
- The American Presidency Project (UC Santa Barbara): Address at the Second Assembly of the World Council of Churches, Evanston, Illinois, August 19, 1954
